Introduction
A common question in legal consultations about the placenta is: “Can the nucleated red cell (nRBC) count at birth be used to time the onset of fetal asphyxia?”. Not an easy question to answer. First, all the confounding causes must be excluded 1(see review below). Fetal hemolysis from Rh alloimmunization, also called erythroblastosis fetalis, demonstrates large numbers of nucleated red blood cells (nRBCs) in the fetal blood. Mothers with ABO or other red cell antigen IgG antibody can also have fetal hemolysis and erythroblastosis. Fetal hemorrhage stimulates erythropoiesis and can increase nucleated red cell levels. Infection, most strikingly with Parvo virus, but also with other STORCH infections (Fig 1), and perhaps ascending infection, may elevate nucleated red cells. Chronic maternal hypoxia from smoking, asthma, or high altitude may elevate nucleated red cells. Small infants with intrauterine growth retardation and large infants from diabetic mothers may all have increased nucleated red cells.
If all the reported confounding variables can be eliminated, then an elevated nucleated red cell count might provide information about intrauterine asphyxia. There is reasonable clinical evidence that nucleated red cells elevate in some infants following fetal asphyxia. Some authors cite the experimental and conceptual model of an episode of hypoxia leading to an increase in erythropoietin secretion, which increases production of red cells and release of immature red cells. This process could take days to elevate circulating nucleated red cells. I believe that a simpler and more probable model is that the endothelium that restricts already formed immature red cells from the circulation responds to ischemic injury by premature release of those immature red cells. The best evidence for this is not from intrauterine asphyxia, but from infants who have cardiac arrest and resuscitation. In a study that was able to look at nucleated red cells counts before and after arrest demonstrated an elevation within 2-3 hours after resuscitation. There are anecdotal human cases that also suggest an elevation in a matter of hours.
In utero, even at term, there is substantial erythropoiesis in the liver sinusoids. Infants dying of intrapartum asphyxia in the neonatal period can show centrilobular necrosis with apparent escape of nucleated red cells into the vascular space. Post mortem light microscopy can not prove this mechanism, but it graphically shows the plausibility of this concept (Fig 2). A corollary to this idea is that release of liver nucleated red cells would be more likely in cases with prolonged partial asphyxia. In this situation blood is shunted from the liver to protect the brain and heart giving time for liver injury to develop. A sudden complete asphyxial injury might be less likely to produce liver injury and nucleated red cell release. This concept is analogous to the patterns of brain injury produced in the fetal monkey by Myer2. Complete asphyxia with resuscitation leads to selective neuronal necrosis, but partial asphyxia before complete asphyxia leads to more wide spread white and grey matter injury. This is only a hypothesis, but it could explain the studies that show a significant correlation of neurologic deficits with elevation of nucleated red cells at birth. Teleologically, ischemic injury of the liver might be a signal to release immature red cells as a compensatory mechanism.
Infants with growth retardation and with loss of end diastolic velocity in the umbilical cord have an elevation of nucleated red cells. The studies did not include placental pathology. One interpretation is that the placentas have decreased utero-placental flow which causes constriction of chorionic vessels to match circulation to respiration, analogous to ventilation perfusion matching in the lung. The decreased perfusion leads to severe chronic hytpoxia with increased erythropoiesis and elevated nucleated red cells. Chronic hypoxia after the initial stimulation of erythropoiesis may establish a new equilibrium without increased nucleated red cells. Most infants that I have autopsied with severe growth retardation demonstrate multiple large infarctions of the placetna. An infarction initially shows fetal vasodilation, which favors blood flow through the dead tissue. There are no studies of how much excess metabolic acid is produced, but in an already ischemic placenta, the insult could conceivably result in fetal acidosis and hepatic endothelial injury hence elevating nucleated red cells.
Many of the published studies were able to measure nucleated red cells in cord blood. This is easier and more accurate than counting nRBCs in the placenta (fig 3). Nucleated red cells can be counted as an absolute number per volume or as a relative number compared to white blood cells. The former method avoids distortion by elevated white blood cell counts, but might be distorted by anemia. A few studies count nucleated red cells in relationship to red cell count. Unless white cell counts are clearly abnormal, the traditional nRBCs per 100 WBC seems a reasonable measure for manual counts, and certainly for counts estimated from placental vessels in section. One problem with this count is that 0 is a substantial part of the distribution of values, making some statistical calculations difficult. Studies often use the natural log value of the count in performing statistical tests. One study even reported results as the natural log!
Other published studies relied on blood drawn from the neonate in the first 24 hours which could be quite different from the cord blood. A few studies tried to look at the curve of disappearance of nucleated red cells. Perhaps most surprising is how fast they disappear in normal neonates. Ideally, the rate of nRBCs disappearance might identify infants with an ongoing erythropoietic stimulus compared to those with a single asphyxial event. Another idea is that the curve up and down of nucleated red cells could time the onset of asphyxia, but the evidence is not convincing to me. There just isn’t enough information on the kinetics of nucleated red cell release and removal to make reliable conclusions.
Except in one early paper, authors have not tried to identify types of nucleated red cells. Most identifiable nucleated red cells are orthochromatic normoblasts. However, in some conditions, such as Parvo virus infection, there appear to be many less mature forms, not easily identified but including erythroblasts (pronormoblasts), basophilic normoblasts, and polychromatic normoblasts. There may be some value in identifying the numbers of less mature erythrocytes to distinguish different mechanisms of red cell release into the circulation. This requires a cord blood smear, rather than a placental section.
Other abnormalities of fetal blood cells seen in placental sections were published here in an early blog. They include the large red cells in triploidy, acanthosis of red cells, and congenital leukemia. The fetal blood cells seen in tissue sections of the umbilical cord and placenta are inferior in morphologic quality to a smear, but they may provide critical diagnostic information. Since the placental villi are perfused by maternal blood, even if flow decreases, abnormalities of fetal blood cells may still be detected even with some postmortem intrauterine retention.
Background on nucleated red cells in the fetal circulation:
Normative data at term and confounding variables
An early study of placental blood nucleated red cell counts in 400 infants with birth weights from 1,080 to 5,350 grams without any exclusions found an average of 9.8 nRBC/ 100 WBC. (8.7 normoblasts, 1.1 erythroblasts)3. Not surprisingly, the counts were higher in the lower weight and premature infants and in the highest weight infants some of whom were hydropic and others likely from gestational diabetes. Of 7 cases with elevated nucleated red cells, six returned to normal within 4 days. Premature infants tended to have a higher ratio of erythroblasts to normoblasts.
A study of nucleated red blood cell counts in umbilical cord blood of 1112 infants ≥ 2,500 g found a mean 8.55, SD 10.27, median of 5 and mode of 1, range of 0 to 89 with a substantial number of 0 values (all expressed as nRBC/100WBC)4. The authors eliminated 9 outliers with NRBC over 100, but retained a long tail on their curve with higher counts of low frequency. The outliers had no complications except one had meconium aspiration, maternal diabetes and ABO incompatibility. The authors found several significant relationships most notably to maternal diabetes (mean 14.6 nRBC/100WBC) and meconium in the amniotic fluid (11.1 nRBC/100 WBC). Some confounding variables such as ABO incompatibility and evidence of maternal fetal hemorrhage were not systematically tested and eliminated. Keeping infants of diabetic mothers as part of the normal population would shift the mean to higher values. A few meconium stained fetuses due to asphyxia may have elevated the mean for the meconium group, rather than meconium passage being the independent variable.
Nucleated red blood cells are less commonly expressed as the number per a volume of red blood (usually 1Liter) or even per the red blood cell count. Since white cell counts can vary, this is some justification for using these measures, but most of the clinical studies cited below use the nRBC to WBC ratio.
Infants of diabetic mothers
A study of neonatal nRBC counts between 12 and 24 hours of life found that 54 non-asphyxiated infants of diabetic mothers had a mean count of 8.3 nRBC/100WBC and a mean absolute count of 1.4 X10⁹nRBC/L compared to 1.7nRBC/100WBC and 0.4 nRBCx109/L in 102 controls5. They recommended using absolute nRBC counts because there was a significant difference in WBC counts, 17×109/L in infants of diabetic mothers compared to 27.3×10⁹in controls.
Hemolytic disease
ABO incompatibility does not produce severe hemolytic disease of the newborn. A series of infants with direct Coombs positive antibodies (61mild, 14 moderate and two high titers with 76 of 77 showing ABO incompatibility between mother and infant) had a mean of 28 ± 55 nRBC/100 WBC compared to 1,584 controls with 8.37± 14 (P=<.0001)6. In the whole study there were 10 outliers with nRBC’s greater than 100/ 100 WBC (range 101-327). Six of these had moderate positive Coombs antibody (one also had meconium aspiration syndrome, and another had hypoxic ischemic encephalopathy). Of the other 4 cases, one had trisomy 21 and one was the infant of a diabetic mother, but two were unexplained.
Twins
A study comparing 37 sets of concordant, appropriate weight for gestational age twins with 29 control infants found a significant difference in nRBC counts using multiple regression that included Apgar scores and gestational age7. The difference however was of small magnitude with wide variation, expressed as mean and standard deviation, twins 451 ± 376 versus controls 297 ± 484 nRBC x106/L
Infection
A study of 359 patients with birth weight between 499 and 1751 grams and a nRBC count within 24 hours found by multiple linear regression, a significant increase of nRBC counts in 166 infants with histological chorioamnionitis, but not with clinical chorioamnionitis8. The value was expressed as the natural log of the nRBC/100 WBC with cases 3.17 ± 1.04 versus controls 2.71 ± 1.27. The histological definition of chorioamionitis was not standard as inflammation had to be present in both amnion and chorion. In practice many placentas diagnosed as chorioamnionitis have neutrophils confined to the chorion.
Chronic fetal hypoxia
Most studies have investigated the relationship of nucleated red cells with fetal hypoxia by correlating conditions thought to be the result of hypoxia rather than measuring intrauterine oxygen concentration.
Maternal asthma
A study of term, appropriate gestational weight infants compared absolute nucleated red blood cell counts in 28 mothers with active asthma compared to 29 controls
- 9. Patients with other conditions known to affect nucleated red blood cells were excluded. Nucleated red cell counts correlated directly with a standard score of maternal asthma (0-4), P<001. Counts of granulocytes, lymphocytes and hematocrit were also significantly elevated. The nucleated red cell counts obtained before 12 hours of life were expressed x 106/L. The controls had a median (range) of 223 (0-2346) and patients 633 (0-8749), but the actual distributions were not published. Asthma severity varied and persistent chronic hypoxia was not documented in the patients, which might explain the wide range. More surprising is the wide range in controls despite attempts to control known confounders. The difference in the medians is only a factor of 2.
Polycythemia and erythropoiesis
The same group of investigators compared absolute nucleated red blood cell counts in term, appropriate weight polycythemic infants of non-diabetic, nonsmoking mothers obtained before 12 hours of life to consecutive controls10. Polycythemia was defined as a venous hematocrit greater than 65% and was speculated to be due to chronic intrauterine hypoxia. Patients with confounding factors including transfusion were excluded. The patients had significantly elevated median nucleated red cells 330 (0-3439) compared to controls 170 (0-588) nRBCx106/L at P=.02. By dividing the median nRBC by the median total RBC count, there were 44 nRBC/1000RBC in polycythemic infants compared to 32 nRBC/1000RBC in controls. Thus, the increase in nucleated red cells is not completely proportionate to the overall increase in nRBCs.
Another study correlated cord blood erythropoietin levels with nucleated red cell counts in normal term infants with a R2 = 0.278 regression line11. Direct inspection of the graph shows for four cases with very high erythropoietin, >300 mu/ml, of which 2 had less than 10, one with 30, and one with 150 nRBC/WBC. Thus, erythropoietin and nRBCs are not always directly related.
Intrauterine growth restriction and/or preeclampsia
Small gestational size may be due to disease causing placental ischemia or decreased exchange function such as maternal floor infarction or fetal thrombotic vasculopathy. Intrauterine growth restriction can also be due fetal disease unrelated to placental function. Preeclampsia is associated with placental ischemia. However, placental ischemia may not necessarily produce fetal hypoxia. Some studies tried to correlate small infants with umbilical cord pH at birth. Others reasoned that fetal hypoxia could be assumed in infants with no or reversed end diastolic velocity in the umbilical artery. Finally, studies using intrauterine umbilical blood sampling were able to directly detect fetal hypoxia, although the studies did not generally have multiple samples over the gestation.
A study that intended to show the relationship between chronic hypoxia and nucleated red blood cells compared 4 groups based on small for gestational size versus appropriate size, each with and without nRBC counts above the 90thpercentile sampled before 6 hours of age12. The “small size, elevated nRBC” group (N=9) did have a significantly lower umbilical cord pH than the “normal size, normal nRBC” group, as well as more complications. However, the authors’ conclusion that the elevated nRBC group distinguished chronically hypoxic small infants was not supported by the data. The “normal size, high nRBC” group had an identical mean umbilical cord pH on the author’s figure 1. With the mean cord pH of 7.11, the elevated nRBC counts could have been due to peripartum asphyxia. A similar study of 906 neonates was divided into the same four groups by the same criteria, but whose outcome values were based on number below certain cutoffs, such as arterial pH <7.20 and umbilical arterial base excess <-8 mmol/L also found a statistical association of “small size, high nRBC” with cord acidosis, poorer Apgar scores, and increased neonatal complications13. The “small size, normal nRBC” group was comparable on these measures to the “normal size, normal nRBC” group. This study also cannot separate peripartum asphyxia from chronic hypoxia.
In a study, 19 small for gestational age fetuses with absent or reversed end-diastolic velocity on umbilical artery Doppler studied within three days of delivery were found to have increased nRBC counts (135 ± 138 nRBC/ 100 WBC) in the first 24 hours compared to 33 small for gestational age fetuses with normal end-diastolic flow (17.4 ±24 nRBC/ 100 WBC)14. The normal velocity group had a higher WBC count, 11,700/ml, compared to the abnormal group mean of 6,600/ml, but this difference is small compared to the nRBC differences. The abnormal flow group showed multiple other significant mean differences including lower birth weight (independently correlated with nRBC count), and measures of greater cord blood acidosis (not correlated with nRBCs). Hemoglobin and hematocrit means were not different. For the abnormal flow group the mean time to < 5 nRBC/100 WBC after birth was 3.4 days (1-11 days range). The authors also found lower platelets in the abnormal flow group. The authors hypothesize that the low platelets and normal hemoglobin levels despite elevated nRBCs suggest increased consumption likely due to intravascular placental thrombosis corresponding to the higher placental resistance. There was no anatomic confirmation.
Another study of infants with in utero abdominal circumference < 5thpercentile who had a Doppler study within 5 days of birth, umbilical cord blood counts and daily neonatal counts also demonstrated increased nRBCs in infants with absent or reversed end diastolic umbilical artery velocity, 65 (2-720), 144 (9-964) respectively, compared to positive velocity 22(2-201), expressed as median (range) nRBC/100WBC15. Likewise days until counts were <5nRBC/100WBC were similarly arrayed median (range), positive velocity 1 (0-2), absent velocity 3.9 (1-8) and reversed velocity 5.2(1-13). The umbilical blood counts at birth for the four neonates that died showed 964,720,273 and 203 nRBC/100WBC. This study collected a large amount of peripartum and neonatal data, which confirmed the association of absent or reversed end diastolic umbilical artery velocity with poor outcome. In stepwise multiple regression many factors were independently related to nRBC count, yet it was not clear that each of these factors was independent of the others.
The authors of the above study had done a similar study looking not at fetal size but the values for Doppler velocity studies in uterine, umbilical, and fetal arteries compared to similar outcome variables16. The number and approach to the variables is confusing, but again there is an overall correlation of worse Doppler velocities with higher nRBC counts16.
Another study of growth restricted infants looked at not only cord blood nRBC counts, but days of persistence of elevated nRBCs based on daily counts and compared these values to a wide range of neonatal outcome variables17. They conclude “The wide range in numbers, complex relationship between triggering factors and effects of other perinatal variables limit the use of the NRBC count as a predictor of perinatal complications”.
A study of genetic amniocentesis cord blood samples evaluated pH, pO2, pCO2, glucose, hemoglobin concentration and nRBC counts from 38 growth retarded fetuses at gestation from 21 to 36 weeks18. The control values for nRBC/100 WBC were said to have leveled off at 23 weeks of gestation and remained at that level, 25nRBC/100WBC. Some of the infants demonstrated marked lactic and/or respiratory acidosis, correlated with hypoxemia. The highest nRBCs (over 500/100WBC in 6 cases) were correlated with the most severe hypoxia. Hypoxia did not correlate with hemoglobin concentration, nor with the degree of growth retardation (based on abdominal circumference). The authors suggest that some growth retardation would not have been on the basis of utero-placental ischemia. Some infants with a difference of 2 or 3 kPa of O2 did not have lactic acidosis nor increased nRBCs. The infants on the graphs of results were not individually identified. It was not possible to know if those without lactic acidosis were also the infants without nRBCs.
A study of umbilical cord blood samples for karyotype in growth restricted fetuses, grouped by absent (32 fetuses) versus normal end diastolic umbilical artery velocity (26 fetuses), found that the only significant predictors of fetal or neonatal death are a nucleated red cell count above 15 x109/l and degree of growth restriction19. nRBC counts did not correlate with hematocrit.
Asphyxia/ acute anoxia
Anderson reviewed the older literature on nucleated red blood cells in the neonate and umbilical cord/chorionic blood in an article in 194120. The main purpose of the article was to establish normative value for term and preterm infants and aborted fetuses. The term infants averaged one 7.3 nucleated red cells (nRBC) per 100 white blood cells (WBC) in cord blood smears and less than 1 per thousand red cells counting in the placental villi. An asphyxiated infant who died at one hour of age was an outlier with 54 nRBC / 100 WBC in the cord blood smear, and in the text 3 nRBC/ 1000 RBC in the placental villi. They related this to an earlier conclusion in a 1929 German paper that an elevation of nucleated red cells was a response of the fetus to a stress such as hemorrhage.
Fox cited Anderson in his own investigation of nRBCs in the placenta. He used a careful counting method with a cut off of approximately 1 nRBC/1000RBC21. Elevated nRBCs had no association with preeclampsia, hypertension or prematurity, but had a strong positive correlation with fetal distress and neonatal asphyxia, p< .0001. There were no specific criteria of distress or asphyxia. Of 36 placentas of stillbirths, 22 (61%) had elevations. 7 of the 14 placentas without elevated nucleated red cells were from deaths immediately after antepartum maternal hemorrhage.
In 1970 three cases of elevated nucleated red blood cells were reported in newborns, two with asphyxia, one from placenta previa (Apgars 1 and 4) and the other from shoulder dystocia (Apgars 0 and 3)22. The count of nucleated red cells per 100 white cells was 220 at 6 hours, 99 at 24 hours, and 20 at 3 days in the first, and 361 at 6 hours and 100 at three days in the second. The normal term cord blood value was 7.3. The authors comment that “the reticulocyte response to hypoxia/erythropoietin is generally not seen until the second or third day after hypoxia.”
Elevated umbilical cord nRBC count correlated with cord blood gas acidemia (pH <7.2) in a study of 1,561 cases 6. The correlation was significant for the subsets of respiratory or uncompensated metabolic acidosis, but not for compensated metabolic acidosis. The authors were surprised that the short duration to develop respiratory acidosis would increase circulating nRBCs. They also found correlations with decreasing pH, decreasing base excess, and Apgar scores. Meconium passage before birth and an admission to the NICU were also associated. The few cases with parameters consistent with asphyxia had the highest mean values. Nine infants with pH< 7.0 had 57.4 (2-276) nRBC/100WBC and 7.78X10⁶nRBC/ml, and 8 infants with an five minute Apgar score equal or less than 3 had 41 (0-151) nRBC/100WBC and 8.3 X10⁶nRBC/ml. These results were not statistically significant compared to normal (N=1442) 8.5 nRBC/100WBC or 1.08 nRBCx106/ml. The small numbers and wide ranges probably accounts for this result. While wide ranges were true in all groups, the more normal the outcome results, in general the smaller the standard deviation. The association may not be a continuum of acidosis to increasing nucleated red cells but a mix of causes and timing (including recovered asphyxial episodes) that statistically appears to show a direct relationship.
A study of three groups of patients, 1) 39 with elective Cesarean section, 2) 55 with spontaneous vaginal delivery, and 3) 55 with emergency Cesarean section demonstrated elevated nRBC correlated with emergency Cesarean section and with umbilical blood pH23.
A similar approach demonstrated elevated nRBC counts in the first 12 hours of life of infants with early onset seizures compared to controls (18.4 v 4.6 nRBC/100WBC, P <.0008 )24. The seizure group had a large range with a median of 10nRBC/100WBC. The contols had a range of only 0 to 11, and only 3 were at 11. The authors argued that for the neonates with seizures and elevated nRBC counts that the intrapartum injury had preceded birth by 48 to 72 hours bases on animal studies, but tempered by a lack of human studies. A letter in response to the study stated that they had considered only an erythropoietin based elevation of nucleated red cells, but that a severe hypoxia by increasing blood flow to the bone marrow and opening pores would allow a rapid egress of already formed nucleated red cells25. There was no citation for this opinion.
In a study of nRBC counts between 12 to 24 hours of age in infants of diabetic mothers, no difference was found between asphyxiated (N=54) and non-asphyxiated infants (N=25), although both groups were elevated compared to controls5. This anomalous result is likely due to the definition of asphyxia as a one minute Apgar score less than 7.
A study correlating nRBC counts with fetal heart rate patterns found a statistical correlation after multiple regression analysis only with the time from last fetal heart rate acceleration to delivery and the nRBC count26. Using a cut off at the 90thpercentile (24 nRBC/100 WBC, the absence of fetal heart rate accelerations within 55 minutes of delivery had a positive predictive value of 39% and a negative predictive value of 96%. This might interpreted that less than one hour of fetal acidosis can elevate nRBC’s, but there could be other explanations since many cases did not have the expected increase.
Low risk term infants with the onset of non-reassuring fetal heart rate tracing had mean higher interleukin 6 levels, lower cord pH, and higher nRBC counts compared to normal term infants. While erythropoietin did correlate with nRBC levels, the mean was not different between cases and controls. No attempt was made to correlate criteria for intrapartum asphyxia or later brain injury. Since interleukin 6 can be stimulated by hypoxia and stimulate red blood cell maturation, and since the onset of the non-reassuring heart rate was likely to result in a short interval before delivery (times were not specified in the report), the authors suggest that Il-6 may be the mediator of a rapid rise in nRBC’s in response to fetal hypoxia. No doubt a spell check error, but the authors note among the associations of elevated fetal nucleated red cells is “intrauterine academia” [sic].
Another way to approach the timing of the nRBC response to acute hypoxia is to look at infants with successful CPR from cardiac arrest. In one such study, the majority of detectable elevation of nRBCs took 2 to 3 hours with the shortest of 1.25 hrs associated with trauma27. This was a study of only 13 patients, age 8 days to 3.5 years with a variety of illness. Nine of the patients had a blood film the day before arrest with no nRBCs in 8 and 0.14 x 10⁹/L in the other. Post CPR levels varied from .03 to 2.0 nRBCS/ 109/L. None of these patients would have had significant hepatic erythropoiesis.
One study that did use criteria of severe acidosis, umbilical cord pH <7.0 and a base excess <-12 mEq/L found a significant elevation of nRBCs in 26 acidemic infants (11.9±13.5 nRBC/100WBC (range 0-45) compared to 3.9±2.9 (range 0-11) in controls28. The study excluded cases with other possible causes of elevated nRBCs. As in all such studies there was a wide scatter of values. Of the 3 infants who developed major neurologic complications two were similar cord pH 6.53, 6.57, Base excess -32.3, -31.5 and nRBCc/100WBC 16,18. The other affected infant had a cord pH of 6.98, BE -13.2 and 11 nRBC/100WBC. None had very high nRBC counts that would have distinguished them, although all were above normal. The authors argue that since metabolic acidosis takes time to develop, and nRBC release follows more than 48 hours after an ischemic event, that these cases demonstrate a long period of prepartum hypoxia. However, there study had no measures of prenatal fetal status.
Brain injury and nRBC count
Naeye and Localio proposed that elevated neonatal lymphocytes and nucleated red cells might be used to time the onset of hypoxic ischemic fetal brain injury29. They analyzed 16 children with quadriplegic cerebral palsy who had a known time of injury based on clinical information, using either the onset of bradycardia, the cessation of fetal movement or in one case the onset of pain with abruption (47 hours before delivery). Of 13 infants with measurements in the first 24 hours, only one was below their choice of high normal of 2,000 nRBC/ml. If the graph letters a-p correspond to the infants in order listed in the table, and if the time of the measurement is plotted accurately on the graph, the infants with ischemic events occurring within 3 hours of birth all have elevations of nRBCs within 12 hours, with 5 appearing to be at 6 hours or less. nRBCs counts after 24 hours have generally dropped below 2000, but there were exceptions and these had dropped considerably from earlier values. Case P had persistent elevation at 5 days. If the case list corresponds to the letter, then this was a case with 74 hours of decreased fetal movement. The criteria for timing of injury may not be valid. The article states “ Only a few minutes are required for severe, sustained ischemia and hypoxemia to cause irreversible brain damage, so we used these manifestations of fetal brain and heart dysfunction as indicators of the time the damage started”. This reasoning is flawed because conditions that cause development of brain acidosis over time can also damage the brain. In the 2 cases of fetal hemorrhage with decreased fetal movement for 24 hours, the injury could have been sustained closer to labor than the onset of decreased movement. This could also be true for the knot in the umbilical cord with decreased movement 50 hours prior to delivery as well as some of the prolonged abruptions. Even more puzzling are two cases of abruption with fetal bradycardia lasting 10 and 20 hours respectively. The article also states that the placentas were examined and all abruptions were acute, yet the clinical timing of the abruptions varies from 0.2 to 74 hours. This suggests that some were more chronic and less than complete, at least at the time of stopped fetal movement.
Phelan and associates have studied the nucleated red blood cell counts in infants from the National Registry for Brain Injured Babies who suffered hypoxic ischemic encephalopathy as neonates 30. They carefully excluded all cases and controls with known causes of elevated nRBCs. They subdivided the cases by fetal heart rate patterns into three groups, group 1 (preadmission): non-reactive FHR pattern from admission to delivery; group II (tachycardia): reactive FHR pattern on admission followed by a prolonged and sustained FHR tachycardia with decelerations and loss of FHR variability; group III (acute): reactive fetal heart rate pattern on admission with the occurrence of an acute catastrophic event such as a uterine rupture or cord prolapse resulting in a prolonged FHR deceleration. The measures included first blood cell count (either cord or neonatal), peak count and time to normalization of count. The 46 neurologically impaired infants had a higher mean count (timing of this count not given) than 83 controls, 34 compared to 3 nucleated red cells per 100 white cells, p <0.0001. There was a wide range in the cases from 1 to 45 nRBC/ 100 WBC, and all of the cases with values above the mean were in a subgroup that had a nonreactive fetal heart tracing from the time of admission. This group also had a significantly longer time to normalization. The study was retrospective and the authors could not determine the time of the asphyxial event. The eight cases with uterine rupture all had nucleated counts below twenty.
This group repeated the study with a larger total of 153 neurologically impaired infants and found essentially the same results31. There was an unequivocal mean elevation of nRBS in the first blood count in all of the asphyxiated infants compared to controls, but the graphic presentation shows that there are large numbers of asphyxiated infants with nRBCs in the normal range. The subgroup data is graphed only for the peak nRBC level, but this seems to show that there is a subgroup of infants in group I with very high values, while most in group 1 and all the infants in groups II and III have much lower values. A clearance time is calculated based on the interval from birth to a blood count of 0. Not clear is how often blood was counted. The values are in hours. Group I had a significantly longer clearance time than the other groups, which is then graphed as a straight line. Naively, it appears that the higher mean value took longer to clear which could reflect simply the quantity of cells. A sample of rounded data presented as nRBCs/ 100 WBC ± SD (range) is the initial nRBC counts for the groups control 3 ± 3.0, (0-12); group I: 49±107 (0-732); group II 11.±10 (0-38); and group III 13±13 (0-76). All three groups were significantly different from the control value. The simplest conclusion is that a subset of infants arriving at the hospital without variability had very high nRBC counts that took longer to clear than those infants with lower counts. Unclear is why the infants in the other groups do not have nRBC counts that eventually reach the level of some in group I.
Phelan and associates relooked at nucleated red cell counts as well as lymphocyte counts in brain injured neonates in two groups, those who had an initial non-reactive fetal heart rate pattern and those who had a normal fetal heart rate pattern on admission but later developed bradycardia32. The preadmission group had 50 of 66 counts with nRBCS greater than the normal value of 2000 cells/ml compared to 18 of 35 in the initially normal group. They also noted that in the 24 to 48 hours after delivery, 12 infants still had elevated nRBCS counts and all of these were in the preadmission injury group. Thus, the differences in the groups may not reflect timing of injury but other factors that result in the persistence of nRBCs, at least in some infants. This could be due to the underlying condition elevating the counts, to reduced clearance of nRBCs or to a continued stimulus for release or increased production and release of nRBC’s.
A study compared 176 infants between 23 and 34 weeks of gestation who developed periventricular leukomalacia (PVL) within 6 weeks of delivery, to gestational age matched controls33. The brain injury group did show a significant mean elevation of nRBC/100 WBC counts, but this association did not remain significant with multivariate analysis. The nRBC count had low predictive value for PVL. Multivariate analysis did preserve an association of elevated nRBCs with oligohydramnios, intrauterine growth restriction, and preeclampsia which all may be markers of placental ischemia and fetal hypoxia. The study also confirmed an association by multivariate analysis with an umbilical cord pH < 7.0 and a base excess of < -12.
A similar study of brain injured infants, birth weight 499 to 1751 grams, with more restrictive timing (brain lesion within 7 days of birth) but broader pathology (PVL or grade III/IV intraventricular hemorrhage) also found no significant increase in nRBC/ 100 WBC in samples within 24 hrs of birth compared to controls matched for gestational age and birth weight34. This study did confirm a relationship of nRBC /100 WBC to small for gestational size independent of gestational age group (above or below 28 weeks) and remaining significant for the 10th, 25thand 50thpercentile comparisons. The mean difference between the lower 10% birth weight group and the high 50thpercentile was 89.7 ±196.6 versus 31.2 ± 34.8. This is a three fold drop in mean although still much higher than normal term infants. There was a much smaller standard deviation in the higher birth weight infants.
A very detailed study with long follow up of both preterm and term infants reported a strong correlation of nRBC counts with many measures of infant neurological outcome and of perinatal hypoxia independent of gestational age35. Absolute values of nRBCs / ml were used, and the ratio to WBC was not given. The study was prospective, used measures of cerebral blood flow determined by Doppler, and had regular neurological assessments until 36 months of age. Controls were matched for gestation and birth weight and there were strict exclusions for known non-hypoxic causes of elevated nRBC counts. The statistics were fairly simple with no attempt to analyze multiple variables nor to develop receiver operator curves to test positive predictive values of the nucleated red cell count for brain injury. The most important results are presented in a 3 D histogram that appears to show mean and standard deviation so the values can only be approximated, which for cerebral Doppler abnormalities at 48 to 72 hours demonstrated a mean 9,000 nRBC/ml compared to controls 3,000, for 6 month old brain sonogram abnormalities hd 8,000 compared to 4,000 and for abnormal neurodevelopment at 3 years of age 6,000 compared to 2,000. The differences were 2-3 fold with separation of the cases and controls by more than one standard deviation. If white cell counts were available and more data presented, comparison with the other more restricted studies would have been possible.
A study of 33 term infants with relatively broader than accepted criteria for perinatal asphyxia (umbilical pH <7.1, base deficit > 10 or a 5 minute Apgar score ≤ 5) found no association of neonatal brain deficit at 30 months of age nor with magnetic resonance spectroscopy evidence of brain injury36These counts were from routine care of the neonate but were done within 24 hours of birth. Interestingly in the graph of the results, the only four infants with counts above 60nRBC/ 100 WBC, all had brain injury.
Placental pathology and nRBC
There is only one significant study that indirectly related placental pathology to fetal nRBCs. The study correlates nRBC counts with cord erythropoietin levels37. Pathological findings in 300 placentas were correlated with erythropoietin levels and umbilical arterial pH. Using multiple regression analysis, meconium phagocytosis and fetal vasculopathy correlated with elevated erythropoietin levels. There was a negative correlation of small placental size with umbilical arterial pH. This study confirmed a correlation of small for gestational age with elevated cord erythropoietin level, and a lack of correlation (N=112) between erythropoietin level and venous hematocrit. Detail was presented on the 10 cases with the highest erythropoietin level. Three had maternal diabetes, three had twin-to-twin transfusion, and 2 had vaginal bleeding, one with bloody amniotic fluid. This study was of limited value in clarifying a relationship between placental findings and nRBC counts, in part because of the use of broad diagnostic categories of placental findings.
Animal studies of hypoxia
In a pregnant rat model using a hypoxic chamber over 2 hours that resulted in 41 % decrease in maternal oxygen tension and a decrease in blood pH and was known to produce neuronal brain injury in the hippocampus and thalamus, the fetal nRBC increase was not significantly above control values until 12 to 24 hours after the maternal hypoxia38.
Pregnant sheep were placed in an environment of 12-13 % oxygen39. This resulted in fetal hypoxemia and increased red cell volume. There was an increase in erythropoietin measured on the earliest sample at 12 hours of hypoxia, but this was statistically back to normal by 7 days. Nucleated red cells were not counted. Another lamb study used maternal nitrogen inhalation to produce acute and chronic hypoxemia and a third group injected with erythropoietin40. With hypoxia, erythropoietin was elevated in the lamb within one day. Reticulocyte counts, which were sampled every other day, peaked at 4 days in all three experimental groups of animals. In a study that produced fetal hypoxemia by injecting sodium nitrate into fetal veins to produce methhemoglobin and hence hypoxemia, erythropoietin was elevated by the fourth hour of a five nitrite infusion41. The infusion was also accompanied by lactic acidosis, and fetal tachycardia. A trial with fetal lactate infusion did not produce any of these effects. Nucleated red cells were not measured.
Basic science of red cell release
Ultrastructural studies found that mature red cells pass through apertures in the endothelial cells at areas without basement membrane or adventitial cells. The latter cells appear contractile and capable of retracting. Erythropoietin treatment of mice results in a two fold increase in reticulocytes within 2 hours and greatly increases the number of apertures. This effect was inhibited in transfused mice, and the packing of red cells in the marrow sinuses was postulated as the mechanism for this inhibition42.
A study of the response of injection of recombinant human erythropoietin into healthy volunteers demonstrated an increase of immature reticulocytes in the first blood sample 12 hours after the injection43. This appeared too early to have been the result of increased erythropoiesis suggesting the early release of the immature cells. No samples were taken closer to the time of injection, and there were no increases in nucleated red cells.
Counting nucleated red cells from the placenta
An absolute red cell count can be done on fetal capillaries and the percentage of nucleated to non-nucleated red cells calculated. This technique was used successfully to estimate gestational age in placentas less than three months of gestation44. After 3 months of gestation, the ratio of nucleated to non-nucleated red cells is on the order of 1 per thousands making exact counts impractical. Another approach is to count the number of nucleated red cells in a measurable area of fetal intravascular space, then calculate the number of nRBC’s per volume of blood. In one study, this technique using either the umbilical cord or large chorionic vessels showed a significant correlation with the neonatal nRBC count obtained within 2 hours of delivery45. The placental mean nRBC count was 1.37 x 10⁹± 1.78 x 10⁹/L compared to the blood count values of 4.81 x 10⁹± 5.46 x 10⁹/L. The study did not evaluate inter-observer variability, but the low counts are very likely due to overestimates of blood volume. Another study demonstrated the futility of trying to count nRBCs in a 10 high power fields of villi unrelated to the number of white or red cells counted46. The numbers of NRBCs in this study did not even correlate with the umbilical cord counts. Fox counted 400 terminal villi with “fully sinusoidal capillaries” per placenta, estimating this included approximately 12,000 red blood cells21. The count was based on villi with a nucleated red cell even if there was more than one nucleated red cell in a villus, which is rare. He found that 95% of placenta had less than 13 positive villi, or less than 1 nucleated red cell per 1000 red cells. Only nucleated red cells with a distinct “hemoglobinized” halo were counted. Lymphocytes superimposed on red cells were distinguished by focusing in different planes.
A much simpler technique that can be practiced without painstaking effort is to count the number of nucleated red cells compared to white cells. This technique was shown to have results not statistically different from counts on umbilical cord blood47. This same study also demonstrated a similar accuracy for determining the number of neutrophils and of lymphocytes per 100 WBC. As the authors point out, changes in magnitude of white cells are small compared to changes in nRBCs. A decrease of 50% of WBC from infection, would give a false doubling of the nRBC count, but as a practical matter given the usually low numbers of nRBCs in tissue section, this error may be less than the inaccuracies from random unevenness in distribution of cells and ambiguities of cell morphology caused by tissue sectioning. Many studies using blood counts have used nRBC/ 100 WBC as the metric and have found useful clinical correlations.
A novel approach was to use a 19 gauge needle aspirate blood into a syringe by random puncture of the placental plate and then aspirating a within a volume of placenta in vitro48. There was direct correlation of nRBC counts by this technique with those obtained by conventional intravascular aspiration of cord blood, but at ½ to 1/3 lower values. This was done in vitro, but the discussion suggests that the results may hold in vivo. Since in vivo there is likely to be much more maternal blood in the intravascular space, the proportion of fetal blood is likely to be lower. A 19 gauge needle is not really a fine needle and could predispose to a real risk of fetal maternal hemorrhage if used aggressively.
Other fetal blood cell abnormalities (from Jan post)
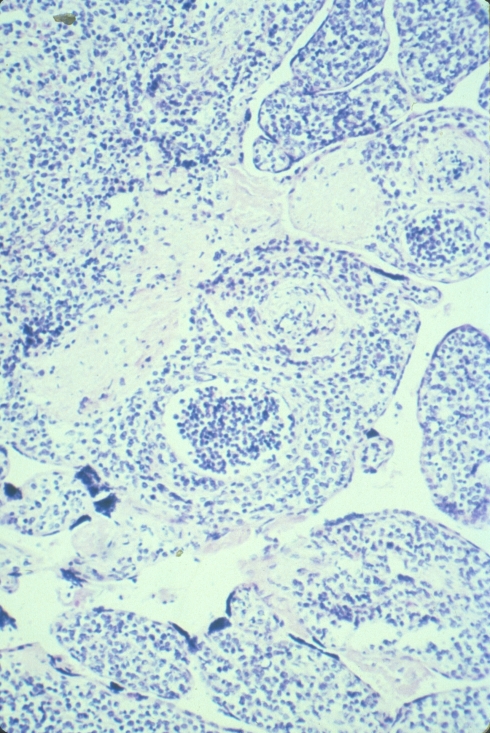
Placental sections provide an opportunity to look at fetal blood, admittedly inferior to a blood smear. I recent interesting case in point was the placenta from an almost term infant with a prenatal diagnosis of IUGR and of hepatomegaly. The villi appeared mature, but not enough to account for the growth restriction. The villi in the center of the placentone (spiral artery flow pattern) were slightly edematous. Perhaps, that is why I looked a little more closely at the fetal blood, which appeared hypercellular. This is often the low power observation that prompts a closer look for increased nuclear red cells. In this case, there was a more or less monomorphic mononuclear cell accumulation. This observation prompted bringing up the infant’s medical record with the thought that the cells might be the result of trisomy 21. There was no indication of Down syndrome, but the total white cell count was 229,000 with 45% blasts pre therapy. The diagnosis was congenital acute B cell leukemia.
I at first was elated at having made an observation that correlated with the infant findings, but then was deflated that my diagnosis had not really added any useful information. Still, looking at fetal blood on the placental sections can add information and at the least confirm that the abnormal blood picture was congenital.
I have attached some microphotographs of the above case and other examples of fetal blood lesions in the placenta.
References:
- Hermansen MC. Nucleated red blood cells in the fetus and newborn. Arch Dis Child Fetal Neonatal Ed 2001;84(3):F211-5.
- Myers RE. Four patterns of perinatal brain damage and their conditions of occurrence in primates. Adv Neurol 1975;10:223-34.
- Javert C. The occurrence and significance of nucleated erythrocytes in the fetal vessels of the placenta. Amer J Obstet Gynecol 1939;37:184-94.
- Hanlon-Lundberg KM, Kirby RS, Gandhi S, Broekhuizen FF. Nucleated red blood cells in cord blood of singleton term neonates. Am J Obstet Gynecol 1997;176(6):1149-54.
- Green D, Mimouni F. Nucleated erythrocytes in healthy infants and in infants of diabetic mothers. J Pediatr 1990;116:129-31.
- Hanlon-Lundberg KM, Kirby RS. Association of ABO incompatibility with elevation of nucleated red blood cell counts in term neonates. Am J Obstet Gynecol 2000;183(6):1532-6.
- Sheffer-Mimouni G, Littner Y, Mimouni FB, Mandel D, Deutsch V, Dollberg S. Nucleated red blood cells in concordant, appropriate-for-gestational age twins. Am J Obstet Gynecol 2004;191(4):1291-5.
- Leikin E, Garry D, Visintainer P, Verma U, Tejani N. Correlation of neonatal nucleated red blood cell counts in preterm infants with histologic chorioamnionitis. Am J Obstet Gynecol 1997;177(1):27-30.
- Littner Y, Mandel D, Sheffer-Mimouni G, Mimouni FB, Deutsch V, Dollberg S. Nucleated red blood cells in infants of mothers with asthma. Am J Obstet Gynecol 2003;188(2):409-12.
- Mandel D, Littner Y, Mimouni FB, Dollberg S. Nucleated red blood cells in polycythemic infants. Am J Obstet Gynecol 2003;188(1):193-5.
- Ferber A, Fridel Z, Weissmann-Brenner A, Minior VK, Divon MY. Are elevated fetal nucleated red blood cell counts an indirect reflection of enhanced erythropoietin activity? Am J Obstet Gynecol 2004;190(5):1473-5.
- Minior VK, Shatzkin E, Divon MY. Nucleated red blood cell count in the differentiation of fetuses with pathologic growth restriction from healthy small-for-gestational-age fetuses. Am J Obstet Gynecol 2000;182(5):1107-9.
- Axt-Fliedner R, Hendrik HJ, Wrobel M, Friedrich M, Schmidt W. Significance of high and normal neonatal nucleated red blood cell count in small-for-gestational-age newborns. Clin Exp Obstet Gynecol 2002;29(1):49-53.
- Bernstein PS, Minior VK, Divon MY. Neonatal nucleated red blood cell counts in small-for-gestational age fetuses with abnormal umbilical artery Doppler studies. Am J Obstet Gynecol 1997;177(5):1079-84.
- Axt-Fliedner R, Hendrik HJ, Schmidt W. Nucleated red blood cell counts in growth-restricted neonates with absent or reversed-end-diastolic umbilical artery velocity. Clin Exp Obstet Gynecol 2002;29(4):242-6.
- Axt-Fliedner R, Ertan K, Hendrik HJ, Schmidt W. Neonatal nucleated red blood cell counts: relationship to abnormal fetoplacental circulation detected by Doppler studies. J Ultrasound Med 2001;20(3):183-90.
- Baschat AA, Gembruch U, Reiss I, Gortner L, Harman CR. Neonatal nucleated red blood cell count and postpartum complications in growth restricted fetuses. J Perinat Med 2003;31(4):323-9.
- Soothill PW, Nicolaides KH, Rodeck CH, Clewell WH, Lindridge J. Relationship of fetal hemoglobin and oxygen content to lactate concentration in Rh isoimmunized pregnancies. Obstet Gynecol 1987;69(2):268-71.
- Nicolini U, Nicolaidis P, Fisk NM, et al. Limited role of fetal blood sampling in prediction of outcome in intrauterine growth retardation. Lancet 1990;336(8718):768-72.
- Anderson G. Studies on the nucleated red cel count in the chorionic capillaries and the cord blood of various ages of pregnancy. Am J Obstet Gynecol 1941;42(1):1-14.
- Fox H. Vascular tumors of the placenta. Obstet Gynecol Surv 1967;22:697-711.
- Mercer BM, Miodovnik M, Thurau GR, et al. Antibiotic therapy for reduction of infant morbidity after preterm premature rupture of the membranes a randomized controlled trial. JAMA 1997;278:989-95.
- Thilaganathan B, Athanasiou S, Ozmen S, Creighton S, Watson NR, Nicolaides KH. Umbilical cord blood erythroblast count as an index of intrauterine hypoxia. Arch Dis Child Fetal Neonatal Ed 1994;70(3):F192-4.
- Blackwell SC, Refuerzo JS, Wolfe HM, et al. The relationship between nucleated red blood cell counts and early-onset neonatal seizures. Am J Obstet Gynecol 2000;182(6):1452-7.
- Hermansen MC. Potential for brief but severe intrapartum injury among neonates with early-onset seizures and elevated nucleated red blood cell counts. Am J Obstet Gynecol 2001;184(4):782-3.
- Ferber A, Grassi A, Akyol D, O’Reilly-Green C, Divon MY. The association of fetal heart rate patterns with nucleated red blood cell counts at birth. Am J Obstet Gynecol 2003;188(5):1228-30.
- Frey B, Horisberger T. Release of nucleated red blood cells early after cardiorespiratory arrest. J Pediatr Hematol Oncol 2003;25(2):180-1.
- Blackwell SC, Refuerzo JS, Hassan SS, Wolfe HM, Berry SM, Sorokin Y. Nucleated red blood cell counts in term neonates with umbilical artery pH < or = 7.00. Am J Perinatol 2001;18(2):93-8.
- Naeye RL, Localio AR. Determining the time befor birth when ischemia and hypoxemia initiated cerebral palsy. Obstet Gynecol 1995;86:713-9.
- Phelan J, Ahn M, Korsi L, Martin G. Nucleated red blood cells: a marker for fetal asphyxia. Am J Obstet Gynecol 1995;173:1380-4.
- Korst L, Phelan J, Ahn M, Martin G. Nucleated red blood cells: an update on the marker for fetal asphyxia. Am J Obstet Gynecol 1996;175:943-6.
- Phelan JP, Korst LM, Ahn MO, Martin GI. Neonatal nucleated red blood cell and lymphocyte counts in fetal brain injury. Obstet Gynecol 1998;91(4):485-9.
- Silva AM, Smith RN, Lehmann CU, Johnson EA, Holcroft CJ, Graham EM. Neonatal Nucleated Red Blood Cells and the Prediction of Cerebral White Matter Injury in Preterm Infants. Obstet Gynecol 2006;107(3):550-6.
- Leikin E, Verma U, Klein S, Tejani N. Relationship between neonatal nucleated red blood cell counts and hypoxic-ischemic injury. Obstet Gynecol 1996;87(3):439-43.
- Buonocore G, Perrone S, Gioia D, et al. Nucleated red blood cell count at birth as an index of perinatal brain damage. Am J Obstet Gynecol 1999;181(6):1500-5.
- Hamrick SE, Miller SP, Newton NR, et al. Nucleated red blood cell counts: not associated with brain injury or outcome. Pediatr Neurol 2003;29(4):278-83.
- Maier RF, Gunther A, Vogel M, Dudenhausen JW, Obladen M. Umbilical venous erythropoietin and umbilical arterial pH in relation to morphologic placental abnormalities. Obstet Gynecol 1994;84(1):81-7.
- Blackwell SC, Hallak M, Hotra JW, et al. Timing of fetal nucleated red blood cell count elevation in response to acute hypoxia. Biol Neonate 2004;85(4):217-20.
- Kitanaka T, Alonso JG, Gilbert RD, Siu BL, Clemons GK, Longo LD. Fetal responses to long-term hypoxemia in sheep. Am J Physiol 1989;256(6 Pt 2):R1348-54.
- Georgieff MK, Schmidt RL, Mills MM, Radmer WJ, Widness JA. Fetal iron and cytochrome c status after intrauterine hypoxemia and erythropoietin administration. Am J Physiol 1992;262(3 Pt 2):R485-91.
- Widness JA, Teramo KA, Clemons GK, et al. Temporal response of immunoreactive erythropoietin to acute hypoxemia in fetal sheep. Pediatr Res 1986;20(1):15-9.
- Chamberlain JK, Weiss L, Weed RI. Bone marrow sinus cell packing: a determinant of cell release. Blood 1975;46(1):91-102.
- Major A, Bauer C, Breymann C, Huch A, Huch R. rh-erythropoietin stimulates immature reticulocyte release in man. Br J Haematol 1994;87(3):605-8.
- Ryerson C, Sanes S. The Age of Pregnancy. Archiv Pathol 1934;17:648-51.
- Curtin WM, Shehata BM, Khuder SA, Robinson HB, Brost BC. The feasibility of using histologic placental sections to predict newborn nucleated red blood cell counts. Obstet Gynecol 2002;100(2):305-10.
- McCarthy JM, Gilbert-Barness E, Tsibris JC, Spellacy WN. Are placental chorionic capillary nucleated red blood cell counts useful compared to umbilical cord blood tests? Fetal Diagn Ther 2007;22(2):121-3.
- Bryant C, Beall M, McPhaul L, Fortson W, Ross M. Do placental sections accurately reflect umbilical cord nucleated red blood cell and white blood cell differential counts? J Matern Fetal Neonatal Med 2006;19(2):105-8.
- Akyol D, Hajdu C, Ferber A, et al. Fine-needle aspiration in the evaluation of nucleated red blood cells in the human placenta. Am J Obstet Gynecol 2003;189(1):155-8.
Figures Legend:
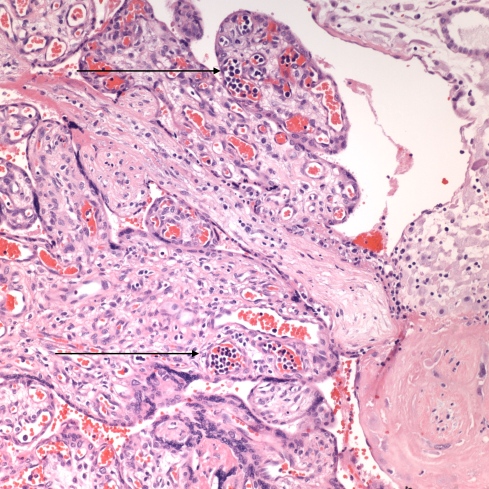
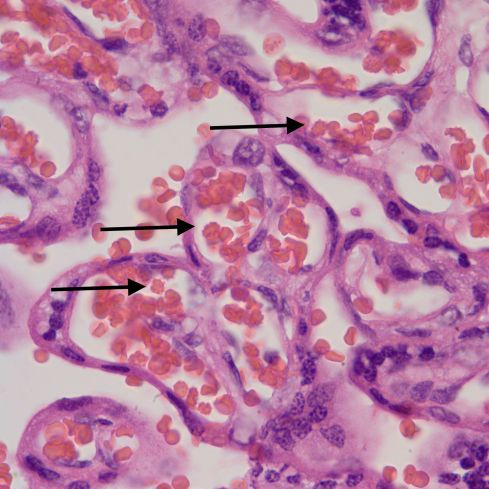
Fig 1A: The arrows demonstrate increased nucleated red cells in the fetal capillaries in the placental villi in an infant with congenital CMV infection. (H&E 20x)
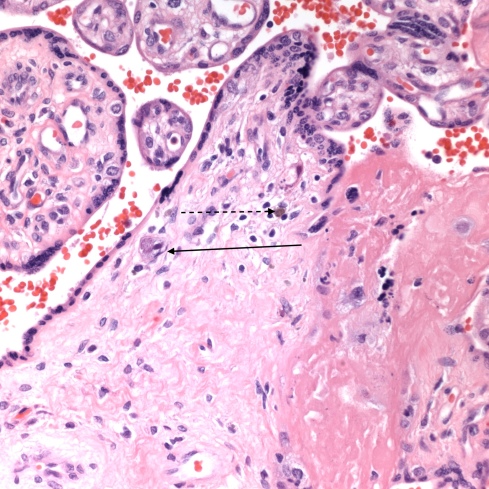
Fig 1B: The arrow points to a cell with CMV nuclear and cytoplasmic inclusions in the same placenta as Fig 1A. The dotted arrow points to deposition of hemosiderin which is characteristic of CMV infection in the placenta. (H&E 40x)
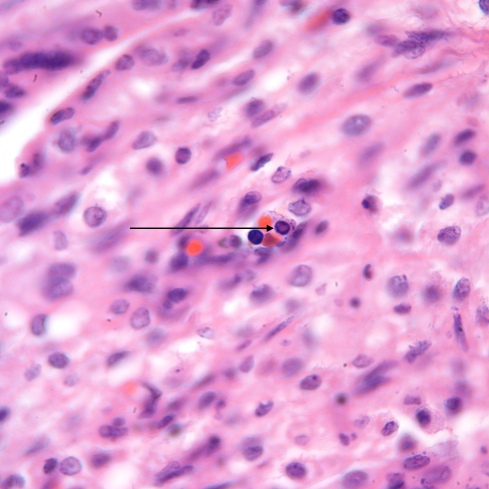
Fig 1C: The arrow points to a nucleated erythrocyte precursor with a central pale eosinophilic inclusion of Parvo virus. (H&E 100x)
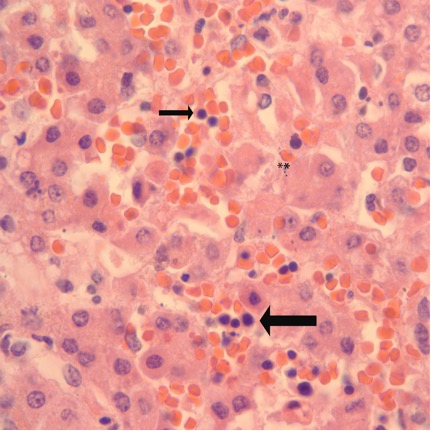
Fig 2A: Liver from a term infant dying following asphyxia at birth. The large arrow points to a focus of sinusoidal erythropoiesis. The ** show an area of cell necrosis. The small arrow points to a nucleated red cell that may be in the circulation. (H&E, 100X)
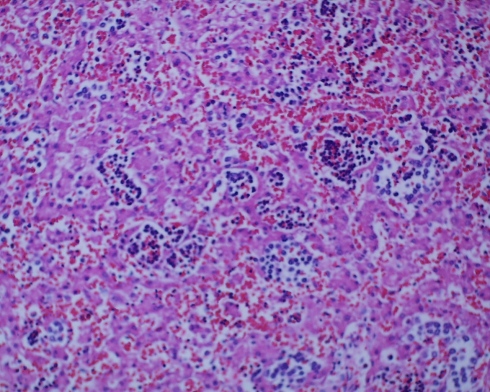
Fig 2 B: Liver from a term stillborn infant with erythroblastosis demonstrating the increased in size, and synchrony of erythroblastic cells in the liver. (H&E, 20x)
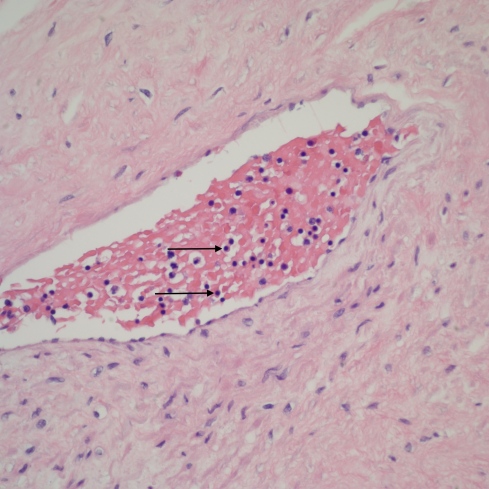
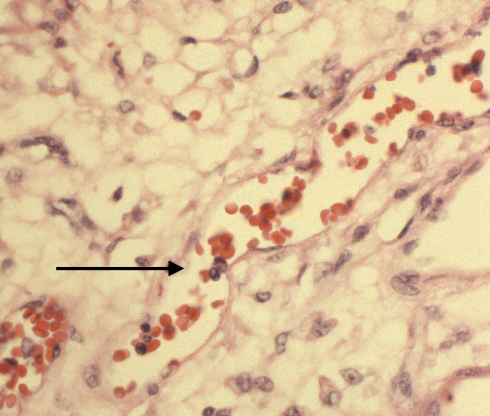
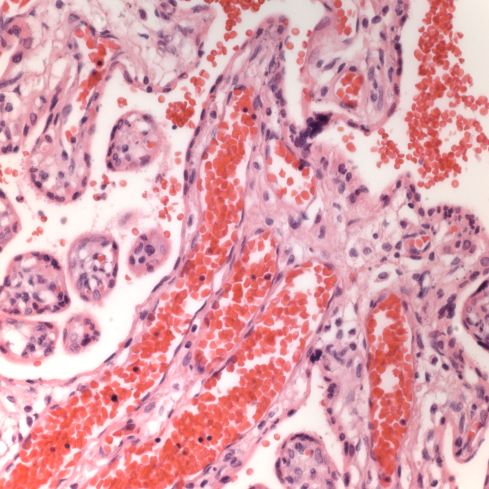
Fig 3A: The image is of a stem vessel in the placenta of a term stillborn infant with marked pallor. The arrows point to typical nRBS with very round dense nuclei and a pale pink hemoglobin cytoplasmic halo. Because of overlapping and partial cells, a relative count of nRBS compared to WBC is difficult, but can not identify increased nRBCs. (H&E 20x)
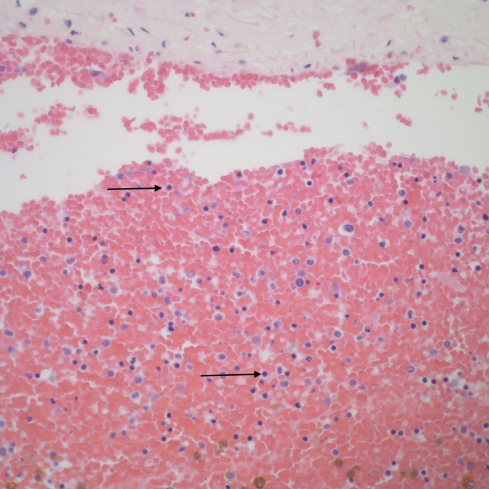
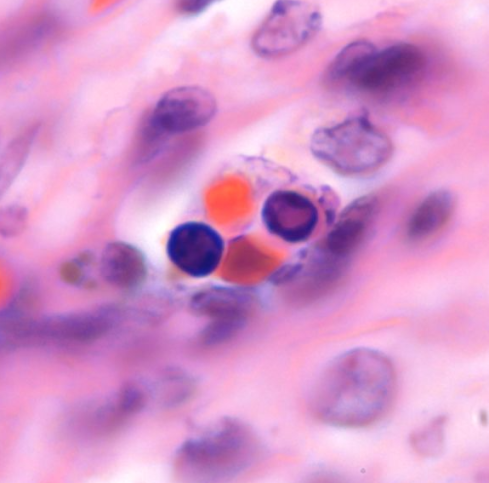
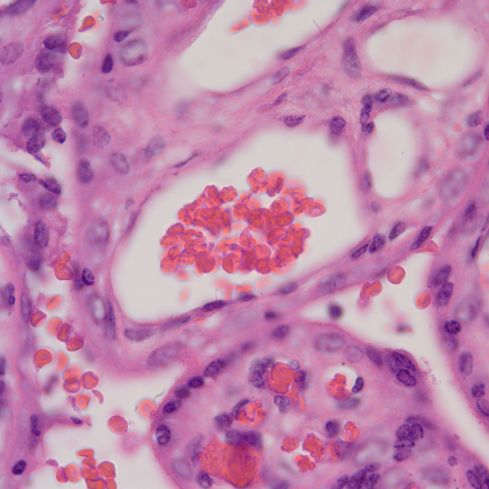
Fig 3B: The image is an umbilical vein from a term, stillborn infant of a diabetic mother. The arrows point to nRBCs. (H&E 20x)
Fig 3B: The image is an umbilical vein from a term, stillborn infant of a diabetic mother. The arrows point to nRBCs. (H&E 20x)
Images from older post
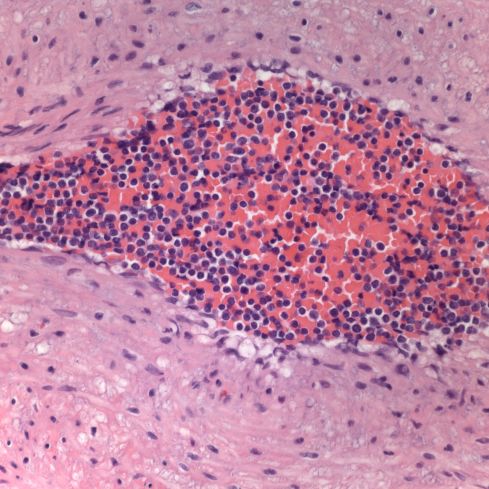
This low power image shows the increased nucleated blood cells in the stem vessel.
The fetal blood at first looked like increased nucleated red cells, but the cytoplasm was clear not red, and the overall impression was a monomorphic mononuclear population.
A case of familial congenital leukemia:
Medium power showing leukemic cells in vessels but also in the villous stroma.
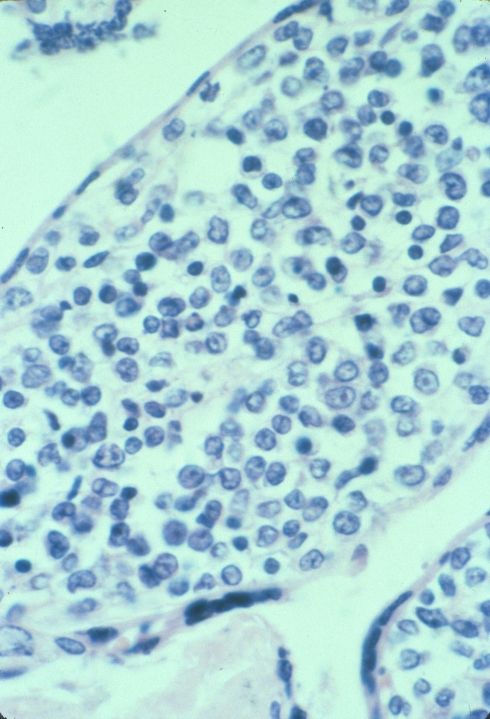
High power showing the leukemic blasts.
A placenta from an infant with karyotype 48XXY+21
This placenta had scattered possible blasts and an abnormal blood picture but my notes are missing.
Parvo virus inclusion on H&E stain in an immuno-chemically proven case of infection.
The eosinophilic inclusions of parvo virus in the nucleated red cells.
Large red cells in triploidy
The red cells are consistently larger in the fetal vessels compared to the maternal cells in the intervillous space in this 20 week fetus with dysgenic triploidy.
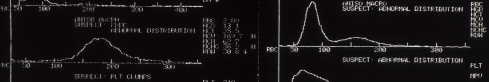
On this Coulter strip, the red cell population on the left from the PUBS shows the large cells. The comparison on the right is after a neonatal red cell transfusion which show the normal peak and the residual triploid population.
Acanthocytosis in an infant with absent liver apoproteins
The acanthocytes sometimes appear as knobs or as darker small spheres.
Slightly less crowded together acanthocytes.
