Abstract:
Objective: Fetuses with intrauterine growth restriction have a known increased risk of intrauterine death. This study uses a database of autopsies to investigate the specific mechanisms that underlie these deaths.
Methods: Autopsies of stillborn infants were included if singleton, greater than 21 weeks of gestation, normally formed, and below the third percentile birth weight for gestation (Group A) or between the third and tenth percentile (Group B). The placental findings, gestation, sex, organ weights, and presence of intrathoracic petechiae and pleural effusions were tabulated. The gestational age distribution and the incidence of gross placental lesions were compared to the gestational ages and incidence of those lesions in a series of placentas from consecutive deliveries (N=5,237).
Results: Group A (N=79) and Group B (N=42) infants demonstrated similar findings with a saw tooth gestational age distribution with 31, and 34 week medians respectively, a high incidence of effusions (82) compared to petechiae (26) and frequent placentas with multiple infarctions, Group A 38 (48%), Group B 8 (19%). Those with multiple infarctions showed severe thymic involution. The live born controls both those <third percentile birth weight for gestation (N=58) and the third to tenth percentile (N=183) controls had a median gestation of 39 weeks, and 4% of placentas had multiple infarctions.
Conclusion: Fetal death in small for gestation infants tends to occur through out gestation, shows signs of chronic stress and heart failure, and has a predominance of placentas with multiple infarctions.
Introduction:
As a nonsystematic observation, I have found that the placenta of most stillborn infants diagnosed as having intrauterine growth restriction (IUGR) had multiple infarctions, retroplacental hematomas, and other lesions that created an anatomic decrease in functional placental volume. They did not show purely villous adaptation to utero-placental ischemia1. Early studies with percutaneous umbilical cord blood pH testing confirmed that small for gestational age fetuses could be hypoxic /acidotic2. Reasonably, an IUGR fetus who is hypoxic and acidotic is more likely to die in-utero3. To avoid stillbirth, delivering all IUGR infants preterm might prevent stillbirth but is clearly unnecessary as many more survive than die. The limits of arbitrary early delivery of small infants was demonstrated in a study of induction at 36 weeks of gestation of IUGR infants that did not find a significant difference in adverse outcome compared to controls with just expectant monitoring4. Many growth restricted stillbirths die before 36 weeks of gestation. Effective intervention requires identifying those fetuses at high risk of stillbirth prior to 36 weeks of gestation. A review of prenatal risk factors in growth restricted infants including Doppler velocimetry in the umbilical arteries, found that maternal BMI, symphysial-fundal height measurement and targeted ultrasound could be used to reduce 20% of IUGR stillbirths5. If the informal observation of an increased number of placental lesions in stillbirth could be confirmed by a systematic review, prenatal detection of those lesions might be an additional criterion for determining a high risk of stillbirth.
In a previous review of stillbirths with the diagnosis of retroplacental hematoma, the infants with the largest placental separations usually demonstrated intrathoracic petechiae and those from smaller but still lethal separations demonstrated dilated cardiac chambers and intrathoracic effusions6. The petechiae can be interpreted as evidence of gasping from near total acute asphyxia. The effusions can be interpreted as the result of hypoxic/acidotic heart failure from prolonged fetal hypoxia.
This study is a retrospective review of small for gestation (SGA) stillborn infant autopsies to examine the placental lesions, and the autopsy evidence for acute versus chronic intrauterine hypoxia.
Methods:
A Filemaker Pro database of autopsy information from autopsies performed or supervised by the author over approximately 30 years was searched for infants ≥ 22 weeks of gestation, with survival of <0 hours. Many already had a category designation of utero-placental ischemia, but a listing of all cases was made and the current standard for birth weight for gestation table for males and for females was used to select all cases under the third and between the third and tenth percentile of birth weight for gestation7. Those under the third percentile were also noted specifically. Autopsies with a major malformation, monochorionic twins, or a chromosome anomaly were not included. Any material on the cases was reviewed to try to assure accuracy of the information that was extracted including gross photographs, and microscopic slides if available. The information that was evaluated were gestational age, autopsy weight, organ weights of the brain and thymus, evidence of intrathoracic petechiae, evidence of intrathoracic effusions, and descriptions of the gross and microscopic lesions of the placenta. Using Filemaker Pro inherent formulas, the ratios of thymus and liver to brain weights were calculated, as well as averages with standard deviations for any subgroups.
For a comparison group the IRB approved a search of the pathology department computer database over a period in which our department received placentas from all deliveries at 2 institutions. The data was de-identified and only the sex, birth weight, Apgar scores, gestational age in weeks, and the final placental diagnosis were obtained. All cases that were liveborn, and small for gestational age and sex were utilized for comparison of gestational age distribution and placental findings.
All of the data was entered onto Microsoft Excel spreadsheets for calculations and graphing.
Results:
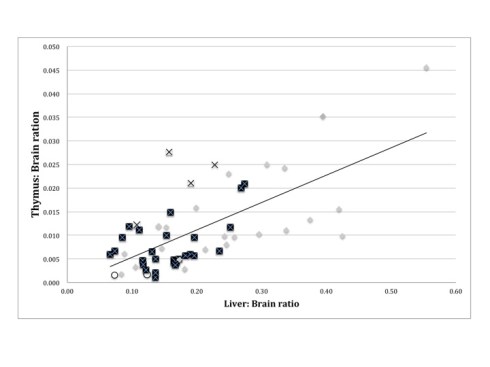
The review found 79 infants below the third percentile of birth weight for gestation, and 42 between the third and tenth percentile birth weight for gestation after excluding monochorionic twins, major malformations, and chromosome abnormalities. The results for stillborn infants <3% are tabulated in Table 1. In the <third percentile group, the median gestation was 31 weeks, with a very irregular distribution (fig 1). Ten infants had intrathoracic petechiae, 48 did not, and 21 had no information. Fifty five had thoracic effusions, 5 did not, and 19 had no information. Of 67 with data, the average thymus: brain ration was .017 ± .03, and liver: brain weight ratio of 0.2 ± 0.2. The placentas demonstrated 38 with multiple infarctions (48%), 6 with hydrops and erythroblastosis, 6 with retroplacental hematoma as the major feature, 5 with villous changes of utero-placental ischemia (3 with one infarction), 5 with fetal thrombotic vasculopathy, 4 with maternal floor infarction, 3 with Breus mole, and 1 massive chronic intervillositis. The multiple infarctions varied greatly in the estimated volume of placental infarcted. The 27 infants with multiple placental infarctions and weight data had an average thymus: brain weight ratio of .007± .005. The distribution of the thymic and liver to brain ratios for the infants with multiple infarctions compared to other lesions is plotted in figure 2.
In the third to the tenth percentile of birth weight for gestation stillborn group, the median gestation was 34 week with an irregular distribution over gestation (fig 3). Sixteen had intrathoracic petechiae, 19 did not, and 17 had no information. Thoracic effusions were present in 27, absent in 7 and no information in 18. The mean thymus: brain weight ratio was .0145 ± .01 and mean liver: brain: weight ratio was .0.21 ± 0.23. The placental lesions included 8 multiple infarctions (19%), 6 retroplacental infarctions, 4 fetal thrombotic vasculopathy, and 1 severe villitis. There were 2 placentas with villous dysmaturity, likely aneuploidy. Of 5 infants with data who had placental infarctions, the mean thymus: brain ratio was .009 ± .01. Combining the infants with multiple infarctions in both groups, the median gestation was 28 weeks.
In the series of placentas from consecutive deliveries, 5,237 cases had all of the required information and the median gestation was 38 weeks. The median gestation of 58 infants less than third percentile for gestation was 39 weeks with a skewed distribution toward term(fig 4). Three infants had gross placental lesions (2 multiple infarctions (3%), and one retroplacental hematoma). The median gestation of 183 infants between the third and tenth percentile was also 39 weeks with a similar distribution to those less than third percentile (fig 5). Seventeen had grossly detectable lesions of the placenta (7 multiple infarctions (4%), 3 fetal thrombotic vasculopathy, 3 severe villitis, 2 massive perivillous fibrinoid infiltration, 1 retroplacental hematoma, and 1 massive subchorionic thrombohematoma. In both control groups combined, there were 13 placentas with villous dysmaturity consistent with aneuploidy, a microscopic diagnosis.
Discussion:
A retrospective autopsy study over 30 years suffers from a lack of random selection of cases and from incomplete data. The gestational ages were those accepted at the time, but not necessarily based on an early ultrasound or other confirmation. Thymus and liver to brain weights were demonstrated in a large perinatal collaborative study to be relatively constant ratios over gestation and can be compared across gestation. The average thymus to brain weight in that study was 0.027 and the liver to brain ratio 0.321 8. There is clinical and experimental evidence that accelerated thymic involution and hence low weight is a fetal cortisol stress response9. The mechanism triggering this stress response in low birth weight infants with utero-placental ischemia is unclear, but the data from this study supports the association of a malnourished infant and a small thymus10. A small liver is a surrogate for decreased body growth11. That the autopsied infants were truly small for gestation was generally supported by the small thymus and liver weights. The findings in both groups of stillborn infants were similar but more marked as expected in those below the third percentile.
As expected many of the infants demonstrated a chronic asphyxial death characterized by pleural and pericardial effusions. These findings were also present in a previous study of retroplacental hematomas in those infants dying with smaller portions of the placenta infarcted6. Some of the infants in the current review demonstrated intrathoracic petechiae, a finding associated with large retroplacental hematomas in the prior study and evidence of a superimposed acute asphyxia event.
The original observation that prompted this study, namely the seemingly large number of gross anatomic abnormalities of the placenta, was reasonably confirmed. The most frequent detectable lesion was that of multiple placental infarctions and with one exception these infarctions were of different times of onset based on gross coloring. While the involvement of the placenta with infarctions was usually below 50%, this functional loss of placental mass may have contributed to the placentas inability to meet fetal oxygen demands. The infants in this group tended to have smaller thymuses and livers like those of known severe placental compromise, maternal floor infarction and massive chronic intervillositis. Multiple placental infarctions were infrequent in live born SGA infants. Non-lethal retroplacental hematomas would also have contributed to substantial placental compromise. Larger placental separations associated with intrathoracic petechiae were likely responsible for sudden asphyxia and may have been related to the underlying cause of fetal growth restriction such as preeclampsia. Another common lesion was fetal thrombotic vaculopathy, which included placentas with thrombi in the umbilical vein in one case and in an umbilical artery in another case. Not surprisingly grossly evident FTV area of avascular villi compromised large volumes of placenta. On the other hand, FTV can also be a surrogate marker of umbilical blood flow occlusion that can cause asphyxia independent of placental function12,13.
A salient difference between the stillborn and live born SGA infants was the distribution by gestational age. The stillbirths occurred with an irregular distribution but throughout gestation and with a median much earlier than the live born infants, which approximated a normal distribution with a mean of 39 weeks, skewed by some preterm deliveries. The number of infants in the low percentile groups was smaller than expected suggesting that the national norms may not reflect those in Louisville, Kentucky.
The median gestation for stillborn infants with multiple placental infarctions was 28 weeks gestation. This often early onset of fetal death with infarctions and the higher incidence of infarctions in stillborn versus live born infants suggest the hypothesis that multiple placental infarctions may be a useful predictor of impending stillbirth if detected prenatally. Placental infarctions have been detected by prenatal ultrasound14. Other placental lesions in this series that have been identified prenatally are maternal floor infarction15, and retroplacental hematoma. These gross placental lesions may have predictive value for stillbirth if detected by prenatal ultrasound. Only a prospective study could demonstrate that documentable morphologic lesions of the placenta have independent predictive value for impending stillbirth.
References
- Redline RW, Boyd T, Campbell V, et al. Maternal vascular underperfusion: nosology and reproducibility of placental reaction patterns. Pediatr Dev Pathol 2004;7:237-49.
- Nicolaides KH, Economides DL, Soothill PW. Blood gases, pH, and lactate in appropriate- and small-for-gestational-age fetuses. Am J Obstet Gynecol 1989;161:996-1001.
- Froen JF, Gardosi JO, Thurmann A, Francis A, Stray-Pedersen B. Restricted fetal growth in sudden intrauterine unexplained death. Acta Obstet Gynecol Scand 2004;83:801-7.
- Boers KE, Vijgen SM, Bijlenga D, et al. Induction versus expectant monitoring for intrauterine growth restriction at term: randomised equivalence trial (DIGITAT). Bmj 2010;341:c7087.
- Imdad A, Yakoob MY, Siddiqui S, Bhutta ZA. Screening and triage of intrauterine growth restriction (IUGR) in general population and high risk pregnancies: a systematic review with a focus on reduction of IUGR related stillbirths. BMC Public Health 2011;11 Suppl 3:S1.
- Bendon RW. Review of autopsies of stillborn infants with retroplacental hematoma or hemorrhage. Pediatr Dev Pathol 2011;14:10-5.
- Olsen IE, Groveman SA, Lawson ML, Clark RH, Zemel BS. New intrauterine growth curves based on United States data. Pediatrics 2010;125:e214-24.
- Fujikura T, Froelich L. Organ-weight/brain -weight ratios as a parameter of prenatal growth: A balanced growth theory of visceras. Am J Obstet Gynecol 1972;112:896-902.
- Bendon RW, Coventry S. Non-iatrogenic pathology of the preterm infant. Semin Neonatol 2004;9:281-7.
- Lansdown AB. Histological observations on thymic development in fetal and newborn mammals subject to intrauterine growth retardation. Biol Neonate 1977;31:252-9.
- Marton T, Hargitai B, Bowen C, Cox PM. Elevated brain weight/liver weight ratio in normal body weight centile term perinatal deaths: an indicator of terminal intrauterine malnourishment. Pediatr Dev Pathol 2013;16:267-71.
- Redline RW. Clinical and pathological umbilical cord abnormalities in fetal thrombotic vasculopathy. Hum Pathol 2004;35:1494-8.
- Saleemuddin A, Tantbirojn P, Sirois K, et al. Obstetric and perinatal complications in placentas with fetal thrombotic vasculopathy. Pediatr Dev Pathol 2010;13:459-64.
- Jauniaux E, Campbell S. Antenatal diagnosis of placental infarcts by ultrasonography. J Clin Ultrasound 1991;19:58-61.
- Mandsager NT, Bendon R, Mostello D, Rosenn B, Miodovnik M, Siddiqi TA. Maternal floor infarction of the placenta: prenatal diagnosis and clinical significance. Obstet Gynecol 1994;83:750-4.
Legend
Figure 1: A histogram of the numbers of small for gestation stillborn infants below the third percentile at each gestational age in weeks.

Figure 2: A histogram of the numbers of small for gestation stillborn infants between the third and tenth percentile at each gestational age in weeks.
Symbols:
Black squares = multiple placental infarctions
X = retroplacental hematoma
O = maternal floor infarction, massive chronic intervillositis
= all others
Figure 3: Scatter chart of infant thymus and liver to brain ratios in stillborn infants below the third percentile

Figure 4: A histogram of the numbers of small for gestation live born infants below the third percentile at each gestational age in weeks.
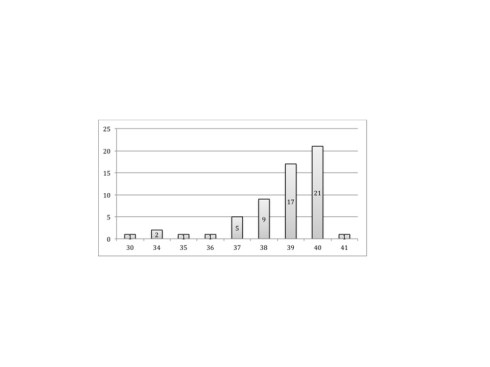
Figure 5: A histogram of the numbers of small for gestation live born infants between the third and tenth percentile at each gestational age in weeks.

Table 1: Review of stillborn autopsies less than the third percentile birth weight for gestation;
| gest | ret | sex | weight | brain g | thymus g | liver g | p | eff | placenta |
| 36 | 12 | m | 1675 | 240 | 6 | 74.00 | p | p | Breus |
| 36 | 48 | f | 1615 | 185 | 1.9 | 54.80 | a | p | Breus mole |
| 25 | 48 | m | 270 | 70 | 8.80 | Breus mole, FTV | |||
| 28 | >96 | m | 724 | 8.4 | 1.3 | 12.50 | FTV | ||
| 35 | 36 | m | 1590 | 248 | 2 | 61.00 | FTV | ||
| 32 | >96 | f | 1100 | 130 | 3 | 32.40 | a | p | FTV |
| 39 | 96 | f | 2280 | 11.6 | 80.20 | a | p | FTV | |
| 36 | 48 | m | 1560 | 217 | 2.4 | 73.40 | p | FTV | |
| 33 | >96 | m | 1420 | 270 | 4.2 | 113.30 | a | p | hydrops |
| 24 | 24 | m | 400 | 70 | 0.2 | 12.70 | a | p | hydrops |
| 29 | 48 | f | 710 | a | p | hydrops | |||
| 32 | 48 | m | 1200 | 170 | 2 | 26.00 | a | p | hydrops |
| 36 | 48 | m | 1820 | 3 | 37.00 | a | p | hydrops | |
| 30 | 48 | f | 800 | 101.2 | 1 | 43.00 | p | hydrops | |
| 31 | >96 | m | 960 | 90 | 4.1 | 49.90 | a | p | inf x1 |
| 26 | 24 | m | 500 | 90 | 0.3 | 9.50 | p | inf x1 | |
| 30 | >96 | f | 910 | 137 | 1 | 20.00 | inf x1 | ||
| 34 | 48 | f | 1070 | 2 | 26.00 | inf x1, 4x5cm | |||
| 33 | 24 | m | 1200 | 120 | 1.6 | 45.00 | a | p | inf x2 |
| 27 | 48 | f | 230 | 63 | 0.1 | 4.60 | a | p | MCI |
| 28 | 48 | f | 338 | MFI | |||||
| 27 | 48 | f | 540 | 0.4 | 10.50 | a | p | MFI | |
| 38 | 96 | f | 2170 | 320 | 1 | p | p | MFI | |
| 34 | 48 | f | 840 | 170 | 0.3 | 21.00 | p | MFI | |
| 27 | 24 | m | 430 | multi-infarct | |||||
| 25 | >96 | f | 417 | 0.4 | 9.30 | a | p | Multi-infarct | |
| 29 | 48 | m | 595 | 85 | a | p | multi-infarct | ||
| 35 | 48 | f | 1400 | 210 | 2.5 | 20.10 | p | multi-infarct | |
| 35 | >96 | f | 1410 | 170 | 27.20 | a | multi-infarct | ||
| 36 | 48 | m | 1460 | 176 | 0.8 | 29.30 | p | multi-infarct | |
| 34 | 1 | m | 1320 | 210 | 1.4 | 49.30 | p | p | multi-infarct |
| 24 | 96 | m | 388 | a | p | multi-infarct | |||
| 35 | >96 | m | 1530 | 120 | 2.4 | 32.20 | a | p | multi-infarct |
| 38 | >96 | m | 1890 | 260 | 1.7 | 34.00 | a | p | multi-infarct |
| 29 | >96 | f | 450 | 60 | 0.6 | 9.20 | a | p | multi-infarct |
| 24 | 48 | f | 300 | 52 | 0.3 | multi-infarct | |||
| 26 | 24 | f | 475 | 95 | 0.1 | 12.90 | a | p | multi-infarct |
| 35 | 1 | m | 1560 | 220 | 4.6 | 60.20 | p | a | multi-infarct |
| 25 | 24 | f | 355 | 53 | 0.2 | 6.20 | a | multi-infarct | |
| 27 | 48 | f | 450 | 80 | 0.4 | 13.80 | a | p | multi-infarct |
| 33 | >96 | f | 850 | 1.1 | 18.50 | a | p | multi-infarct >50% | |
| 30 | 24 | m | 745 | 105 | 0.6 | 19.20 | a | p | multi-infarct >50% |
| 27 | 96 | f | 330 | 50 | 0.1 | 6.80 | a | p | multi-infarct 30% |
| 27 | 48 | f | 510 | 0.9 | 10.20 | a | p | multi-infarct 33% | |
| 37 | 48 | m | 1970 | 270 | 4 | 43.00 | a | p | multi-infarct 5% |
| 32 | 96 | f | 850 | 150 | 0.7 | 17.50 | a | p | multi-infarct 50% |
| 28 | 24 | f | 552 | 105 | 1 | 20.60 | a | multi-infarct 50%,rph 40% | |
| 25 | 48 | f | 455 | 70 | 0.4 | 13.70 | a | p | multi-infarct 50%,rph10% |
| 25 | 96 | f | 400 | 0.1 | 10.00 | a | p | multi-infarct 60% | |
| 24 | 48 | f | 310 | 0.3 | 9.00 | multi-infarct 60%, rph 25% | |||
| 31 | 96 | f | 810 | 0.6 | 18.80 | a | p | multi-infarct 70-75% | |
| 24 | 48 | f | 390 | 50 | 0.3 | 9.50 | a | p | multi-infarct 90% |
| 25 | 48 | f | 394.5 | multi-infarct, rph 2×3 cm | |||||
| 29 | 48 | f | 700 | 120 | 1.4 | 30.20 | a | p | multi-infarct, >50% |
| 27 | 24 | m | 580 | 95 | 0.9 | 8.10 | a | p | multi-infarct, 90% |
| 29 | 24 | m | 620 | 120 | 0.6 | 16.40 | a | multi-infarct, 90%* | |
| 30 | 48 | m | 770 | 150 | 0.4 | 18.20 | multi-infarct, FTV | ||
| 32 | 30 | f | 1006 | 162 | 0.6 | 27.00 | a | p | multi-infarct, RPH 10% |
| 29 | 119 | m | 493 | 90 | 1 | 10.00 | a | p | multi-infarct, rph 20% |
| 24 | 24 | f | 150 | 45 | 0.3 | 3.30 | a | p | multi-infarct, RPH small |
| 27 | >96 | m | 560 | 101 | 0.6 | 6.70 | a | p | multi-infarct, RPH small |
| 35 | 12 | m | 1550 | 280 | 5.9 | 53.40 | p | p | RPH |
| 31 | 12 | m | 900 | 180 | 2.2 | 19.30 | p | a | RPH 100% ,inf x1 |
| 33 | 48 | f | 1170 | 208 | 1 | 36.00 | a | p | RPH 25% |
| 25 | 24 | f | 370 | 60 | 0.2 | RPH 25% | |||
| 24 | 36 | m | 480 | 0.9 | 14.80 | a | p | RPH 50% | |
| 36 | 24 | m | 1845 | 330 | 8.2 | 75.20 | p | p | RPH large |
| 29 | 24 | f | 740 | 105 | 2.9 | 16.50 | p | RPH marginal | |
| 35 | 24 | f | 1460 | 17.3 | 83.20 | umbilical cord ulcer | |||
| 36 | 48 | m | 1190 | 210 | 2.5 | 29.60 | a | p | |
| 40 | 24 | m | 2040 | 345 | 3.4 | 83.80 | a | a | |
| 39 | 12 | m | 1475 | 446 | 15.7 | 176.00 | p | p | |
| 42 | 24 | m | 2470 | 340 | 2.4 | 72.50 | p | ||
| 25 | 48 | m | 190 | 130 | 0.8 | 11.50 | a | a | |
| 39 | 24 | m | 2160 | 310 | 3 | 80.00 | a | p | |
| 25 | 240 | m | 220 | 55 | 0.1 | 4.60 | a | p | |
| 35 | 24 | m | 1360 | 195 | 3.1 | 38.80 | |||
| 35 | 48 | f | 1130 | 200 | 1.8 | a | a | ||
| 40 | 24 | f | 2280 | 350 | 8.5 | 117.50 | p | p |
Key: Blanks indicate a lack of available information. gest = gestational age in weeks, surv = estimated intrauterine postmortem retention in hours, m= male, f=female, weight= autopsy weight, g=grams, p = intrathroacic petchiae, eff= pleural and or pericardial effusion, a = absent, p=present, placenta = gross lesions of the placenta, FTV = fetal thrombotic vasculopathy, inf = infarction, MCI = massive chronic intervillositis, MFI = maternal floor infarction (massive perivillous fibrinoid deposition), RPH = retroplacental hematoma and *=all recent infarctions. The percentages are estimates of the involved area of the placenta.

Leave a comment