Clinical History:
This infant was delivered at 38 weeks, 5 days of gestation by Cesarean section following loss of fetal heart tones. The birth weight was 4,800 grams and the Apgar scores were 0 through 10 minutes, despite resuscitation. At Cesarean section, the infant was vertex with slightly yellow amnion fluid, without cord entanglement or abruption.
The heart tones had been at a baseline of 140-150 with poor beat-to-beat variability, but then decreased to 110 at approximately 4 AM. The patient got up to void, and heart tones could not be found despite different modalities. Blood glucose during this time was 113 mg/dl. Membranes were ruptured artificially at 4:21 to apply scalp electrodes. The infant was delivered at 4:40.
The mother is a 36 year-old G4 P2 SAB 1(10 weeks). Her two other pregnancies were term with babies weighing 10 lbs and 8 lbs 1 oz. She smoked 1 pack of cigarettes per day during the pregnancy with a twenty-year history of smoking. She had been diabetic for two years controlled with glyburide. Her hemoglobin A1C was 9.5 at the beginning of pregnancy. She frequently had glucosuria. A subsequent HgbA1c on 3/8/01 was 8.1%. Her gestation was confirmed with early ultrasound. Her prenatal screening was normal except for a triple screen showing increased risk for trisomy. A subsequent scan with amniocentesis was normal with a normal karyotype.
Autopsy findings:
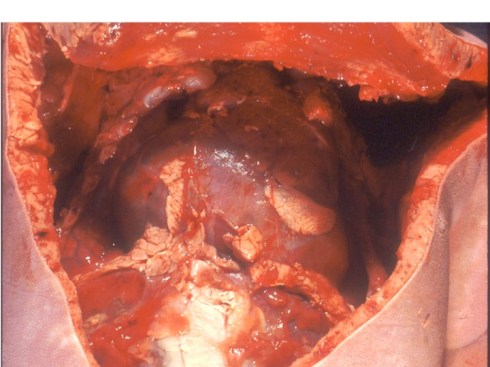
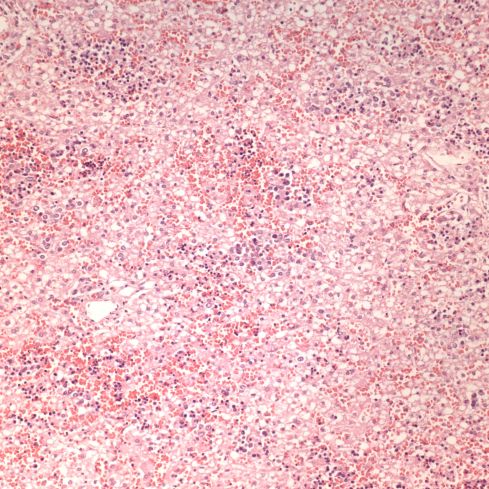
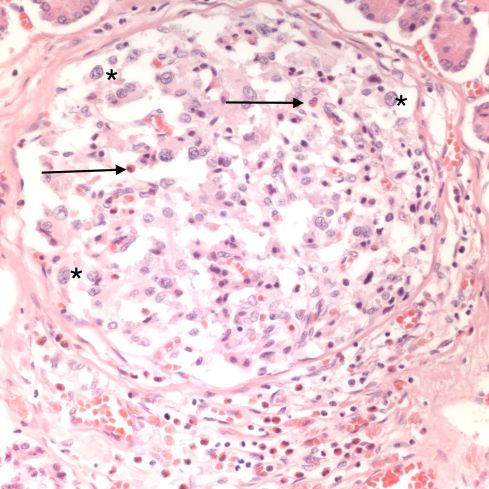
The autopsy demonstrated a large for gestation (4670 g at 39 weeks) infant without evidence of intrauterine retention. There was increased subcutaneous adipose tissue and a relatively enlarged heart (figure 1 and organ weight graph). There was increased hepatic erythropoiesis and circulating erythroblastosis (figure 2). The pancreatic islets demonstrated cell hypertrophy (presumably beta cell) and eosinophil infiltration (figure 3). There were intrathoracic petechiae (figure 4,5). The lateral cerebral ventricles were compressed.
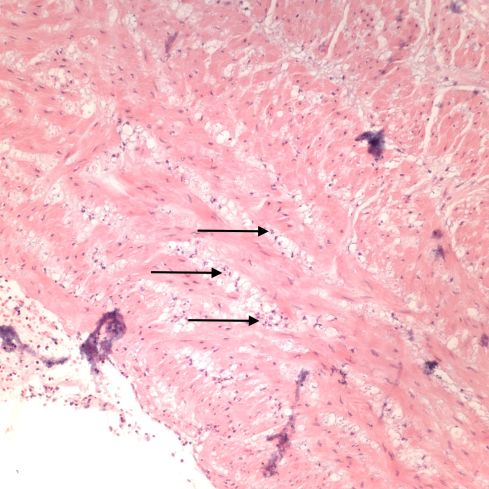
The placenta demonstrated a furcate insertion of the umbilical cord. One of nine samples of the umbilical cord demonstrated neutrophils in the umbilical vein (figure 6). The inflamed vein was in the first sample of cord that included the fetal end, middle end and placental insertion. All other samples were taken afterward did not include the placental insertion. The inflammation was therefore probably near the furcate insertion. There was no other inflammation in the placenta.
Conclusion:
This infant demonstrated marked features of an infant of a diabetic mother. These anatomic findings reflect the clinical history of persistent maternal glucosuria and elevated hemoglobin A1c in his diabetic mother (on glyburide). The cerebral swelling, history of poor beat-to-beat fetal heart rate variability, the inability to resuscitate the infant, and the intrathoracic petechiae (markers of intrauterine gasping), all point to an recent acute asphyxial event that likely was occurring partially or intermittently during the period of decreased variability, and then cardiac collapse at least 20 minutes prior to delivery.
The furcate insertion of the cord may have been a point of vulnerability for cord compression or torsion. The histologic evidence suggests some acute injury to the cord likely near the placental insertion but above the furcate diversion (there were no samples of the furcate vessels). The only photograph of the umbilical cord taken after the fact barely confirms the furcate insertion, but does show a tight coiling of the cord. This evidence of torsion may or may not have been acute.
The role of diabetes was likely at most contributory. However, many infants are stillborn due to intrauterine asphyxia that are not from diabetic pregnancies, and many macrosomic infants from diabetic mothers do not suffer lethal intrapartum asphyxia.
Enter a caption
Figure 1: The heart is prominent as is the thymus. The petechiae are visible on the surface of the thymus. The thick subcutaneous adipose tissue is also evident.
Enter a caption
Figure 2: The liver shows numerous darker clusters of hematopoietic cells with many larger blasts present. The hepatocyte cell clearing may be cell swelling or possibly fat. (20x H&E)
Enter a caption
Figure 3: This pancreatic islet demonstrates numerous hypertrophied cells, examples are marked with *. The arrows point to some eosinophils in the islet. Many more are at the bottom of the islet. (40x H&E)

Enter a caption
Figure 4: This low power photomicrograph of the thymus shows two petechial hemorrhages, one in the center and one toward the lower right area. (4x H&E)

Enter a caption
Figure 5: There are also petechial hemorrhages in the pleura of the lung. (10 x, H&E)
Enter a caption
Figure 6: The arrows point to neutrophils or collections of neutrophils in the umbilical vein. (20x H&E)

Leave a comment